
A Step-by-Step Guide to Pandas Pivot Tables
You may be familiar with pivot tables in Excel to generate easy insights into your data. We will explore how to create Python pivot tables using the pivot table function available in Pandas. The function itself is quite easy to use, but it’s not the most intuitive. This post will give you a complete overview of how to use the function!
The function is quite similar to the group by function also available in Pandas, but offers significantly more customization.
How to Build a Pivot Table in Python
First off, let’s quickly cover off what a pivot table actually is: it’s a table of statistics that helps summarize the data of a larger table by “pivoting” that data. In Pandas, we can construct a pivot table using the following syntax, as described in the official Pandas documentation:
pandas.pivot_table(data, values=None, index=None, columns=None, aggfunc='mean', fill_value=None, margins=False, dropna=True, margins_name='All', observed=False)
The function returns its own dataframe that can be accessed similar to any other dataframe you may come across. Let’s take a moment to explore the different parameters available in the function:
Now that we have an understanding of the different parameters available in the function, let’s load in our data set and begin exploring our data.
Let’s start off by loading our data set! We’ve built a free downloadable data set that can be found at this link. We’ll use Pandas to import the data into a dataframe called df. We’ll also print out the first five rows using the .head() function:
import pandas as pd
df = pd.read_excel('https://github.com/datagy/pivot_table_pandas/raw/master/sample_pivot.xlsx', parse_dates=['Date'])
print(df.head())
Out:
Date Region Type Units Sales
0 2020-07-11 East Children’s Clothing 18 306
1 2020-09-23 North Children’s Clothing 14 448
3 2020-02-28 East Children’s Clothing 26 832
4 2020-03-19 West Women’s Clothing 3 33
Based on the output of the first five rows shown above, we can see that we have five columns to work with:
Now that we have a bit more context around the data, let’s explore creating our first pivot table in Pandas.
Creating a Pivot Table in Pandas
To get started with creating a pivot table in Pandas, let’s build a very simple pivot table to start things off. We’ll begin by aggregating the Sales values by the Region the sale took place in:
sales_by_region = pd.pivot_table(df, index = 'Region', values = 'Sales') print(sales_by_region)
This returns the following output:
Sales Region
East 408.182482
North 438.924051
South 432.956204
West 452.029412
This gave us a summary of the Sales field by Region. Recall from our discussion around parameters earlier, that the default parameter for aggfunc is mean. Because of this, the Sales field in the resulting dataframe is the average of Sales per Region.
If we wanted to change the type of function used, we could use the aggfunc parameter. For example, if we wanted to return the sum of all Sales across a region, we could write:
total_by_region = pd.pivot_table(df, index = 'Region', values = 'Sales', aggfunc='sum') print(total_by_region)
This returns:
Sales Region
East 167763
North 138700
South 59315
West 61476
Multi-Index Dataframes in Pandas
We can already notice a difference between the dataframe that this function put out, compared to the original dataframe (df) we put together. This is because the resulting dataframe from a pivot table function is a MultiIndex dataframes. You can learn more about these dataframes at this link.
As this dataframe is a very simple dataframe, we can simply reset the index to turn it into a normal dataframe:
sales_by_region.reset_index()
Doing this resets the index and returns the following:
Region Sales
0 East 408.182482
1 North 438.924051
2 South 432.956204
3 West 452.029412
Filtering Python Pivot Tables
Let’s filter our data! Source: Nik Piepenbreier
Now that we’ve created our first few pivot tables, let’s explore how to filter the data. Let’s create a dataframe that generates the mean Sale price by Region:
avg_region_price = pd.pivot_table(df, index = 'Region', values = 'Sales')
The values in this dataframe are:
Sales Region
East 408.182482
North 438.924051
South 432.956204
West 452.029412
Now, say we wanted to filter the dataframe to only include Regions where the average sale price was over 450, we could write:
avg_region_price[avg_region_price['Sales'] > 450]
Sales Region
West 452.029412
We can also apply multiple conditions, such as filtering to show only sales greater than 450 or less than 430. I know this is a strange example, but it’s just illustrative:
avg_region_price[(avg_region_price['Sales'] > 450) | (avg_region_price['Sales'] < 430)]
Notice that we wrapped each condition in brackets and separated the conditions by a pipe ( | ) symbol. This returns the following:
Sales Region
East 408.182482
West 452.029412
Creating a Multi-Index Pivot Table
Single index pivot tables are great for generating high-level overviews. However, we can also add additional indices to a pivot table to create further groupings. Say, we wanted to calculate the sum per Type and per Region, we could write the following:
multi_index = pd.pivot_table(df, index = ['Region', 'Type'], values = 'Sales', aggfunc = 'sum') print(multi_index)
This will give us the following:
Sales
Region Type
East Children’s Clothing 45849
Men’s Clothing 51685
Women’s Clothing 70229
North Children’s Clothing 37306
Men’s Clothing 39975
Women’s Clothing 61419
South Children’s Clothing 18570
Men’s Clothing 18542
Women’s Clothing 22203
West Children’s Clothing 20182
Men’s Clothing 19077
Women’s Clothing 22217
We could also apply multiple functions to our pivot table. Say we wanted to have the same pivot table that showed us the total sum but also the count of sales, we could write:
multi_functions = pd.pivot_table(df, index = ['Region', 'Type'], values = 'Sales', aggfunc = ['sum', len]) print(multi_functions)
                              sum      len
                              Sales    Sales
Region Type
East Children’s Clothing 45849 113
Men’s Clothing 51685 122
Women’s Clothing 70229 176
North Children’s Clothing 37306 85
Men’s Clothing 39975 89
Women’s Clothing 61419 142
South Children’s Clothing 18570 45
Men’s Clothing 18542 39
Women’s Clothing 22203 53
West Children’s Clothing 20182 42
Men’s Clothing 19077 41
Women’s Clothing 22217 53
Adding Columns to a Pandas Pivot Table
Adding columns to a pivot table in Pandas can add another dimension to the tables. Based on the description we provided in our earlier section, the Columns parameter allows us to add a key to aggregate by. For example, if we wanted to see the number of units sold by Type and by Region, we could write:
columns_example = pd.pivot_table(df, index = 'Type', columns = 'Region', values = 'Units', aggfunc = 'sum') print(columns_example)
Let’s visualize what this looks like:
Region East North South West
Type
Children’s Clothing 2318.0 1763.0 1017.0 789.0
Men’s Clothing 2420.0 0.0 725.0 829.0
Women’s Clothing 3372.0 2596.0 1056.0 1006.0
This allows us to see the data in a different, more easy-to-read format. It also makes plotting the data out a little easier, as we’ll explore in the next section.
Columns might be one of the more confusing parts of the pivot table function, especially with how they relate to values. Columns are optional as we indicated above and provide the keys by which to separate the data. The pivot table aggregates the values in the values parameter.
Plotting Pandas Pivot Tables
While pivot tables make it easy to summarize data, plotting this data out makes it even easier to identify trends. Let’s, for example, create bar plots for the pivot table we generated with columns. We can do this by writing the following:
columns_example.plot(kind='bar')
This generates the following plot:
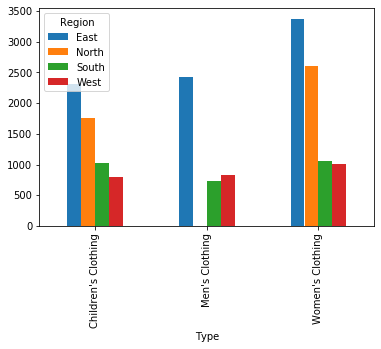 We can now visualize that the East region has the highest sales across Types, and that the South region has the lowest sales across Types.
If you want to find ways to make Matplotlib charts a little less ugly, check out my other tutorial here:
Handling Missing Data in Python Pivot Tables
No data set is perfect! Let’s see how we can handle missing data in Python pivot tables. To see which columns have missing data, we can run the info() function to explore the data set:
print(df.info())
This returns the following output:
<class ‘pandas.core.frame.DataFrame’>
RangeIndex: 1000 entries, 0 to 999
Data columns (total 5 columns):
Column Non-Null Count Dtype
0 Date 1000 non-null datetime64[ns]
1 Region 1000 non-null object
2 Type 1000 non-null object
3 Units 911 non-null float64
4 Sales 1000 non-null int64
dtypes: datetime64ns, float64(1), int64(1), object(2)
memory usage: 39.2+ KB
We can see that Units is the only field with missing values. Let’s see what happens when we generate this following pivot table:
pd.pivot_table(df, index = 'Type', values = 'Units', columns = 'Region', aggfunc = 'max')
This returns the following pivot table:
Region East North South West
Type
Children’s Clothing 35.0 35.0 35.0 34.0
Men’s Clothing 35.0 NaN 34.0 35.0
Women’s Clothing 35.0 35.0 35.0 33.0
The NaN displayed in the table, of course, doesn’t look great. We can choose to fill that value with something else. For example, if we wanted to fill N/A for any missing values, we could write the following:
pd.pivot_table(df, index = 'Type', values = 'Units', columns = 'Region', aggfunc = 'max', fill_value = 'N/A')
The output of this is:
Region East North South West
Type
Children’s Clothing 35.0 35 35.0 34.0
Men’s Clothing 35.0 N/A 34.0 35.0
Women’s Clothing 35.0 35 35.0 33.0
Much better!
Adding Totals for Rows and Columns to Pandas Pivot Tables
For our last section, let’s explore how to add totals to both rows and columns in our Python pivot table. We do this with the margins and margins_name parameters. If we wanted to add this to the pivot table we created above, we would write the following:
pd.pivot_table(df, index = 'Type', values = 'Units', columns = 'Region', aggfunc = 'max', fill_value = 'N/A', margins = True, margins_name='Total')
This returns the following:
Region East North South West Total
Type
Children’s Clothing 35 35 35 34 35
Men’s Clothing 35 N/A 34 35 35
Women’s Clothing 35 35 35 33 35
Total 35 35 35 35 35
The margins parameter requires a boolean (True/False) value to either add row/column totals or not. The margins_name parameter allows us to add labels to these values.
Conclusion: Python Pivot Tables — The Ultimate Guide
In this post, we explored how to easily generated a pivot table off of a given dataframe using Python and Pandas. Pivot tables in Python allow you to easily generate insights into data sets, whether large or small. The multitude of parameters available in the pivot_table function allows for a lot of flexibility in how data is analyzed. In this post, we explored how to generate a pivot table, how to filter pivot tables in Python, how to add multiple indices and columns to pivot tables, how to plot pivot tables, how to deal with missing values, and how to add row and column totals